Testing
Testing notes: load and stress tests, the C10K problem and code coverage.
3 min read
References
- Enterprise Java.next: A Slideless Keynote
- A Note On Jakarta EE Testing
- Achieve Quality Code and ROI through Test Automation
- Apache Bench (ab) Kullanarak Bir Web Servisin Yük Testi Nasıl Yapılır?
Testing
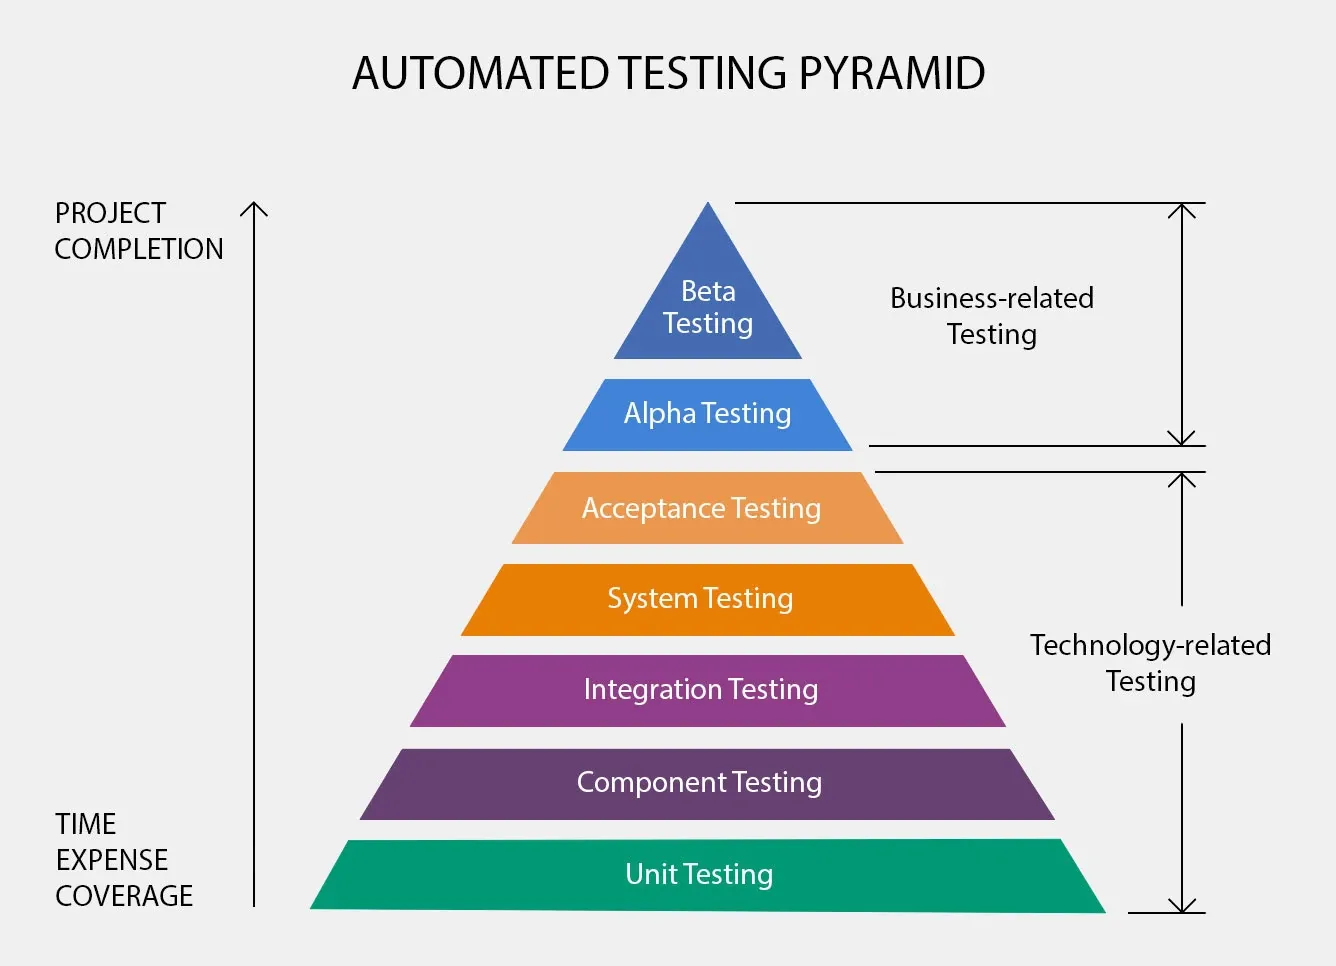
- System level -> Regression/System/Stress/Performance testing
- Controller level -> Integration testing
- Service level -> Unit testing
Load and Stress Test
A load test, by definition, measures the performance of a system under an expected load. In contrast, a stress test overloads a system in order to find the breaking point.
A load test is performed in order to ensure that a website or web application is capable of handling specific numbers of users at once. Load Testing is often used in the process of capacity planning, to ensure that a system is able to handle growth to specified levels of simultaneous traffic.
A stress test is used to specifically push a system beyond its intended capacity to identify components that begin to slow down, identify bottlenecks in the system, and bring to light possible points of failure.
- jmeter - Apache JMeter to load test functional behavior and measure performance. One JMeter instance runs for max 800 users.
- loader.io - Loader.io is a FREE load testing service that allows you to stress test your web-apps & apis with thousands of concurrent connections.
- ab - Apache HTTP server benchmarking tool
- BlazeMeter - Continuous Testing platform. Distributed JMeter for stress test. Uses JMeter scripts. Since it is distributed runs multiple JMeter instance.
Example ab testing for 100 requests with 10 concurrency (clients): We make 100 requests to [url] with 10 concurrency (we can think of it as 10 users making requests at the same time) as follows.
$ ab -k -n 100 -c 10 [url]Example ab testing for 10 clients 1000 times added header:
$ ab -k -n 1000 -c 10 -H “Authorization: Bearer <…token…>” http://api_url/Usually what you get per service at least 4000 transactions per second. 4000-7000 per second per service.
What it means in practice in real world is that application service scalability is never the issue, the problem is always the database.
If the database is not scaled, the more application servers you will start upfront everyone will meet the backend and this usually probably causes problems.
If there is huge number of failed request issue, it is due to dynamic pages. It happens because the Content-Length can vary between the requests. When using ab with such pages you need to use the -l option.
-l Accept variable document length (use this for dynamic pages)C10K Problem
example test can be done with
$ ab -n 10000 -c 16 -l https://domain.com:443/index.htmlThis runs 10.000 HTTP requests with a concurrency of 16.
Example test results:
Concurrency Level:      16Time taken for tests:   403.432 secondsComplete requests:      10000Failed requests:        0Total transferred:      131810000 bytesHTML transferred:       129120000 bytesRequests per second:    24.79 [#/sec] (mean)Time per request:       645.492 [ms] (mean)Time per request:       40.343 [ms] (mean, across all concurrent requests)Transfer rate:          319.06 [Kbytes/sec] received
Connection Times (ms)              min  mean[+/-sd] median   maxConnect:      436  487  66.4    477    1854Processing:   137  157  65.0    149    2022Waiting:      136  150  34.4    146    1168Total:        576  644 106.7    627    2822
Percentage of the requests served within a certain time (ms)  50%    627  66%    641  75%    652  80%    656  90%    669  95%    716  98%    841  99%   1012 100%   2822 (longest request)
Code Coverage
- JaCoCo - Java Code Coverage Library
<plugin> <groupId>org.jacoco</groupId> <artifactId>jacoco-maven-plugin</artifactId> <version></version> <executions> <execution> <goals> <goal>prepare-agent</goal> </goals> </execution> <execution> <id>report</id> <phase>prepare-package</phase> <goals> <goal>report</goal> </goals> </execution> </executions></plugin><plugin> <groupId>org.jacoco</groupId> <artifactId>jacoco-maven-plugin</artifactId> <version></version> <executions> <execution> <id>default-prepare-agent</id> <goals> <goal>prepare-agent</goal> </goals> </execution> <execution> <id>default-report</id> <phase>prepare-package</phase> <goals> <goal>report</goal> </goals> </execution> <execution> <id>default-check</id> <goals> <goal>check</goal> </goals> <configuration> <rules> <rule> <!--requires a line coverage minimum of 50% for every class except test classes--> <element>CLASS</element> <excludes> <exclude>*Test</exclude> </excludes> <limits> <limit> <counter>LINE</counter> <value>COVEREDRATIO</value> <minimum>50%</minimum> </limit> </limits> </rule> </rules> </configuration> </execution> </executions></plugin>